Building Energy Boot Camp 2018 - Day 1

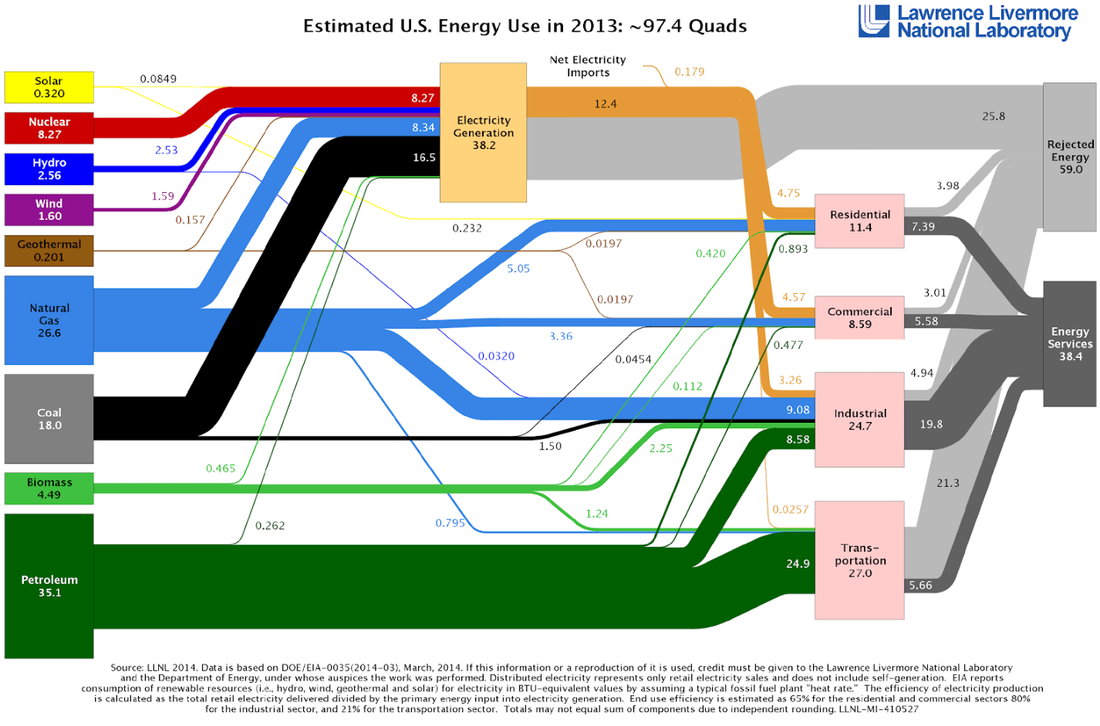
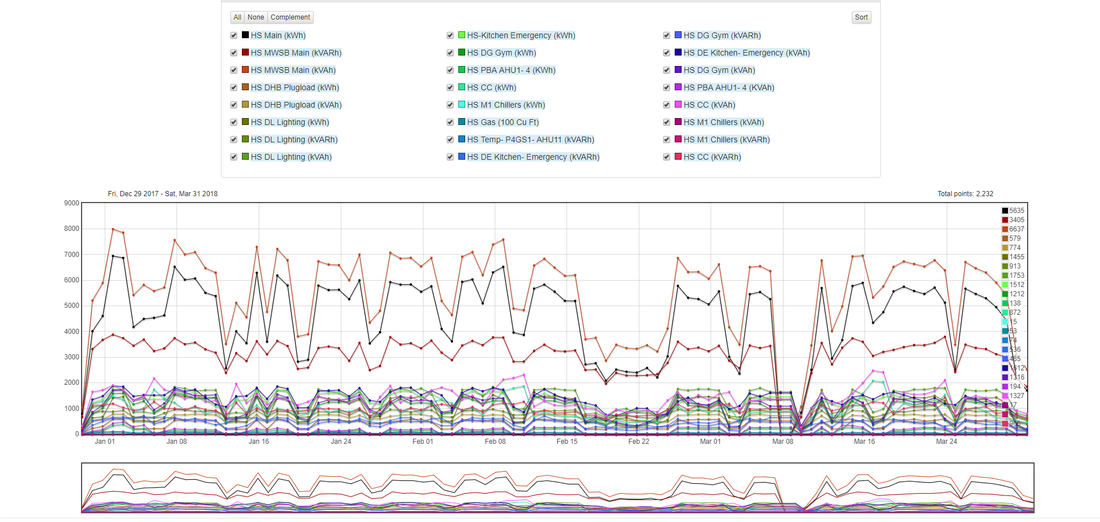
Throughout our first meeting, we learned about how much energy we lose during conversion. Energy loss is a big problem because making energy costs a lot of money, and if we’re losing the majority of the energy that we make. We examined energy flow charts (like the one shown below) and discussed the effects of the lost energy. Afterwards, we connected to our energy dashboard and examined graphs of energy usage in our school’s various rooms, as well as energy usage of all the different schools in our school district, Andover Public Schools. From these graphs, we realized that the schools in our district waste a lot of energy late at night, when nobody there. Specifically, we examined energy usage between 11:00 PM and 4:00 AM, and were shocked to see how much energy was used.
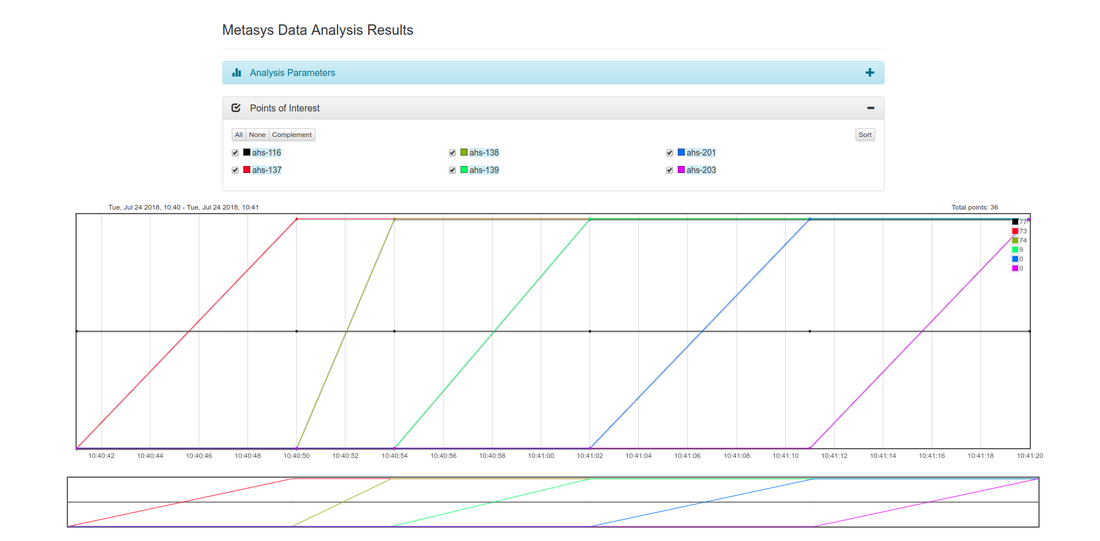
In addition, we setup our API, the buildingEnergyAPI. Using this tool, we connected to a data server containing the current condition (temperature, CO2 levels) of every room in our school. We then wrote a python script to read the condition of every room from this data server and reformatted the data to store it into a CSV that our plotting software could read. The code I wrote for this is shown below: Plotting the file ahs_air_out.csv that the code creates produces the following result: