Building Energy Boot Camp 2019 - Day 5

Today, I returned my focus to the matplotlib project we were assigned on Day 2 of the boot camp. I made tremendous progress, and nearly finished the entire project. I successfully implemented a multi-threaded data-retrieval system. Most notably, the threading class is completely and safely killable, something I have found terribly difficult to achieve with Python in the past. See Killable Threads - Background and Killable Threads - The Code for a detailed explanation of how I achieved this. I also learned about many of matplotlib’s features that I was previously unaware of, including the abilities to set custom tick marks along the x and y axes, scroll the graph without deleting off-screen points, and bind function to various user-inputted events in the opened window. By using these features, I was able to add much more functionality to the graph, such as panning and zooming with the mouse wheel. Throughout the rest of this post, I will describe in detail the process behind these additions.
Killable Threads - Background
In Python, there is no way to safely “kill” an instance of the threading.Thread class. That is to say, there is no way to stop the Thread’s execution of its target function without running the risk of leaving open critical resources that must be closed. You could always terminate the entire program by using sys.exit(), but, for the aforementioned reason, this is a very dangerous practice, particularly so in my case, as I sought to save all the data collected by the threaded function to a CSV file (a tabular format). However, I did not always want to wait for said function to finish whenever a user requested the termination of the program, as the process of requesting and storing sensor data typically takes anywhere between 10 and 15 seconds. When this long delay is added to the time required to output all stored data to a file, I was facing a shutdown time long enough to bore users into forcibly killing my program as a whole, which both be risky for their computers and my program’s chances of outputting its data to a file. With this in mind, I set about modifying my threaded function, continuous_update, to make it quickly and safely terminable. Here’s how I achieved this goal:
Before I explain the implementation of my killable system, I will first explain the general structure of the Line Graph portion of my boot camp code (which is available on GitHub!) and the relationship between its files. My code currently follows this file structure:
Building-Energy-Bootcamp-2019
├── BuildingEnergyAPI       # Python package containing the API used to get data from our sensors
├── csv                     # Contains csv files with the data needed to request from a sensor
├── LineGraph               # Python package containing files specific to the Line Graph
│   ├── app.py              # The main file that runs the Line Graph
│   └── update_thread.py    # The file containing the code defining the DataUpdateThread class
├── pylive                  # Python package my modified version of pylive, used to plot data
│   └── pylive.py           # The file containing the code related to initializing and updating the graph
└── ...                     # etc. (Other directories and files unrelated to the Line Graph)
To run the Line Graph, the file LineGraph/app.py is executed from the Building-Energy-Bootcamp-2019 (root) directory. This file imports DataUpdateThread, the class that asynchronously manages the data-retrieval process, from LineGraph/update_thread.py, and instantiates a copy of the class, providing the pandas DataFrame (in short, a table of data) used by the entire project to the class. It also manages the initialization and updates of the line graph, using methods from the file pylive/pylive.py. This entire process and relationships can be summarized by the following 3 code snippets:
from LineGraph.update_thread import DataUpdateThread
from pylive.pylive import live_plotter_init, live_plotter_update, has_been_closed

...

update_thread = DataUpdateThread(data_df, csv_path, output_path)
update_thread.begin_update_thread(update_interval)

...

live_plotter_init(data_df, ...)
Although the vast majority of the code in app.py has been omitted in these snippets, enough may be derived about the relationship between app.py, update_thread.py, and pylive.py. The important thing to notice about this code is that the same DataFrame instance is being passed to pylive.py’s methods and to the DataUpdateThread’s constructor. Following the rules of object oriented design and references to objects, this means that both the update thread and the plotter are referencing the same table, with the same data. Thus, when the DataUpdateThread instance requests new data and appends it to the end of the table, the plotter’s reference to the data table sees the same changes. To maintain this connection and communication, both update_thread.py and pylive.py are entirely dependent on app.py. The two files have no direct means of communication, but rather must rely on methods in app.py to relay any important information, such as the user’s request to close the graph, initiated by their press of the X button. Keep this in mind as I explain how I made my DataUpdateThreads terminable.
Killable Threads - The Code
As the update_thread.py and pylive.py files are completely blind to each other, I designed both to be centered around management by app.py. The first changes that I made were to the DataUpdateThread class, starting with its constructor:
class DataUpdateThread:
    def __init__(self, df, csv_path, output_path):
        self.data_df = df
        self.csv_path = csv_path
        self.output_path = output_path
        self.thread = None
        self.stopped = False
        self.fully_stopped = False
Note the two fields stopped, and fully stopped. They are both booleans, and default to False. stopped represents whether or not a call to stop the thread’s execution has been made, and fully_stopped is set to True when the thread has been stopped and the information in data_df has been saved to output_path, signifying that a completely safe shutdown is ready. I also defined a stop(self) method and a is_fully_stopped(self) method, to allow app.py to remotely trigger the shutdown process and to provide an accessor that informs app.py when it can safely stop.
Next, I turned to continuous_update, a method that repeatedly calls get_new_values (which requests new data and appends it as a row at the bottom of the data_df shared with pylive.py) until a stop is requested.
def continuous_update(self, repeat_interval):
    while True:
        if self.stopped or has_been_closed():
            break
        self.get_new_values()
        if self.stopped or has_been_closed():
            break
        time.sleep(repeat_interval)

    self.save_data()
    self.fully_stopped = True
Before and after it begins the process of requesting new data, this method first checks if a stop has been requested or if the pylive window has been closed (using has_been_closed()). If either of these conditions of met, it exits its infinite loop and saves its data before flagging the thread as fully_stopped.
Finally, to allow the interruption of the 10-15 second long method get_new_values, I used a similar strategy:
def get_new_values(self):
    df = pd.read_csv(self.csv_path)
    retrieved_data = []

    for index, row in df.iterrows():
        value, units = get_value(row['Facility'], row['Meter'], live=True)

        value = float(value) if isinstance(value, numbers.Number) else ''
        retrieved_data.append(round(value, 2))

        if self.stopped or has_been_closed():

            return
    retrieved_data.append(dt.datetime.now())

    # Add to the end of the DF
    self.data_df.loc[len(self.data_df)] = retrieved_data
After receiving data from a sensor, the method checks to see if a stop has been requested by either app.py or the user. If that is the case, it exits the function without bothering to request data from the remaining sensors, or appending the incomplete data to the end of the dataframe. This greatly reduced the shutdown times, as users now would have to wait, in the worst case scenario, for only one piece of data to be received instead of a piece of data from each sensor.
Lastly, I defined the proper_shutdown method in app.py, which always ensures a safe shutdown of the program and thread.
def proper_shutdown():
    print("Shutting down, please wait...")
    update_thread.stop()
    while not update_thread.is_fully_stopped():
        time.sleep(0.5)
    print("Fully shut down")
    sys.exit()
This method takes advantage of my new additions to the DataUpdateThread class to ensure the thread has safely stopped and has saved its data before ending the program. By utilizing the atexit library, I made sure that proper_shutdown() is run before the program terminates for any reason. To communicate a shutdown to app.py when the graph is closed, I used matplotlib’s event bindings to call a method that initiates proper_shutdown, window_closed:
close_bind = fig.canvas.mpl_connect('close_event', window_closed)
And with that, my killable threads were done!
Graph Interactivity Improvements
Today, I also modified pylive.py to make my graph more complete and interactive. First, I made the view scroll with the graph by setting the limits of both the x and y axes to always fit the 10 most recent points of every line, which allowed me to plot the entirety of the data_df DataFrame. To make off-screen data visible, I programmed in the ability to scroll with the mouse wheel and planned on utilizing matplotlib’s prebuilt panning system. However, I quickly realized that the bound-setting code I had added for scrolling would always send the panned graph back to its original position. I fixed this by binding new methods to mouse events and adding a new boolean variable, panning_allowed, that stops the code from adjusting the limits of the visible portion of the x and y axes while the user’s mouse is inside the graph. This made my graph very interactive and easy-to-use.
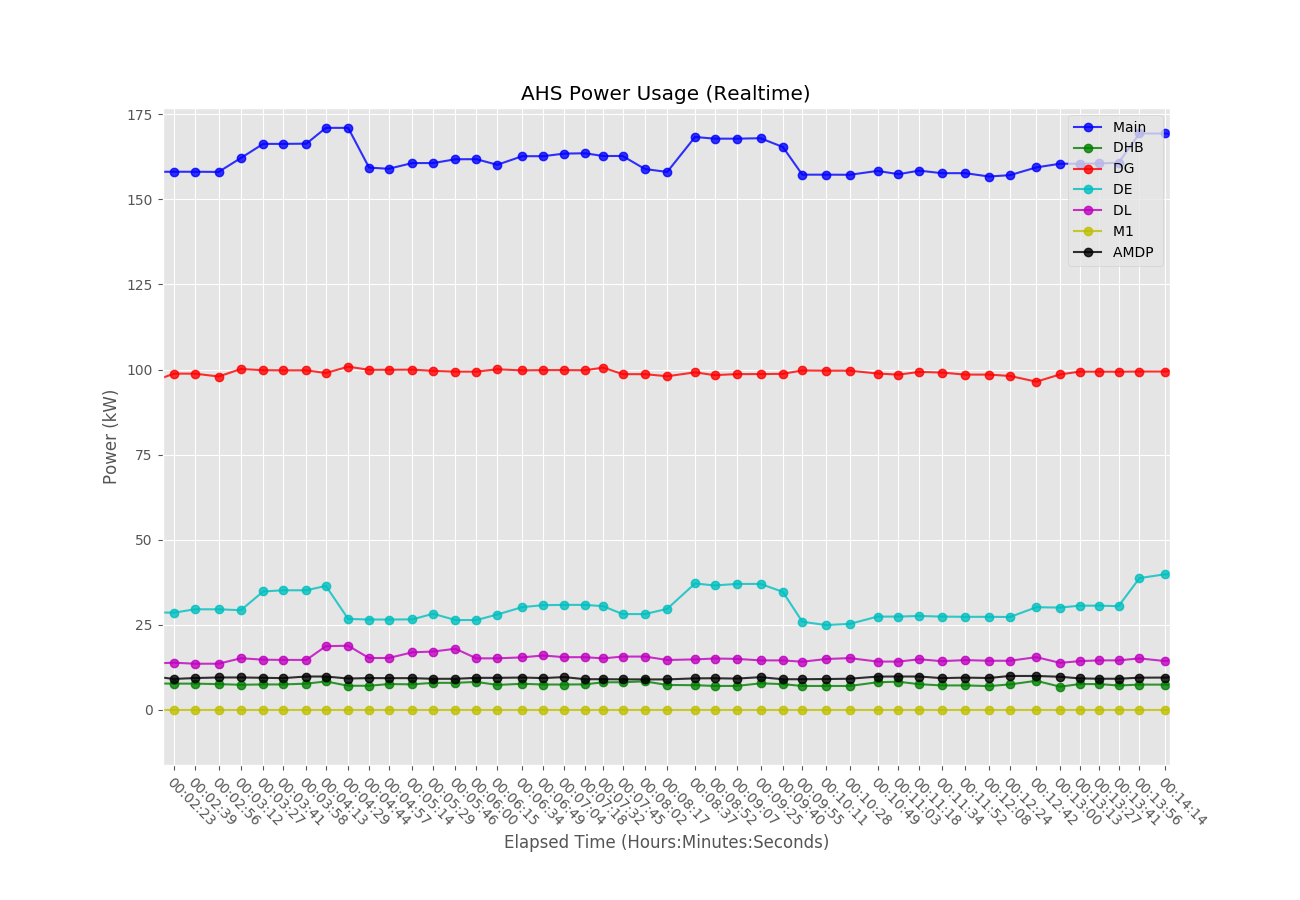
Screenshots
.png)
Code
import os
import sys
import time
import atexit
import numbers
import pandas as pd
import datetime as dt
from LineGraph.update_thread import DataUpdateThread
from BuildingEnergyAPI.building_data_requests_external import get_value
from pylive.pylive import live_plotter_init, live_plotter_update, has_been_closed

# Open dataframe
csv_path = os.path.join('csv', 'ahs_power.csv')
output_path = os.path.join('LineGraph', 'line_graph_out.csv')
df = pd.read_csv(csv_path)


def get_readings():
    values = []

    for row_num in range(num_lines):
        value, units = get_value(df.loc[row_num]['Facility'], df.loc[row_num]['Meter'], live=True)
        value = float(value) if isinstance(value, numbers.Number) else ''
        values.append(round(value, 2))

    return values


# Pull Labels
labels = [row['Label'] for index, row in df.iterrows()]
columns = labels + ['Time']

# How many seconds between updates
update_interval = 2

# How many lines to use (number of rows in df)
num_lines = len(df.index)

# Setup data storing dataframe
initial_values = get_readings()
initial_values.append(dt.datetime.now())
data_df = pd.DataFrame([initial_values], columns=columns)
data_df['Time'] = pd.to_datetime(data_df['Time'])  # Index by datetime

update_thread = DataUpdateThread(data_df, csv_path, output_path)
update_thread.begin_update_thread(update_interval)


def proper_shutdown():
    print("Shutting down, please wait...")
    update_thread.stop()
    while not update_thread.is_fully_stopped():
        time.sleep(0.5)
    print("Fully shut down")
    sys.exit()


try:
    # Properly shutdown when sys.exit() is called
    atexit.register(proper_shutdown)

    lines = [None for line_num in range(num_lines)]

    color_options = ['b', 'g', 'r', 'c', 'm', 'y', 'k', 'w']

    # Cycle through every color in the order shown in color_options
    formats = ['{0}-o'.format(color_options[format_num % len(color_options)]) for format_num in range(num_lines)]

    live_plotter_init(data_df, lines, formats, [item.replace('(kW)', '') for item in labels],
                      title="AHS Power Usage (Realtime)", xlabel='Elapsed Time (Hours:Minutes:Seconds)',
                      ylabel='Power (kW)')

    while True:
        live_plotter_update(data_df, lines)
        if has_been_closed():
            sys.exit()

except KeyboardInterrupt:
    proper_shutdown()
import threading
import numbers
import time
import os
import sys
import pandas as pd
import datetime as dt
from pylive.pylive import has_been_closed
from BuildingEnergyAPI.building_data_requests_external import get_value


class DataUpdateThread:
    def __init__(self, df, csv_path, output_path):
        self.data_df = df
        self.csv_path = csv_path
        self.output_path = output_path
        self.thread = None
        self.stopped = False
        self.fully_stopped = False

    def get_new_values(self):
        df = pd.read_csv(self.csv_path)

        retrieved_data = []

        for index, row in df.iterrows():
            value, units = get_value(row['Facility'], row['Meter'], live=True)

            value = float(value) if isinstance(value, numbers.Number) else ''
            retrieved_data.append(round(value, 2))

            if self.stopped or has_been_closed():
                return

        retrieved_data.append(dt.datetime.now())

        # Add to the end of the DF
        self.data_df.loc[len(self.data_df)] = retrieved_data

    def continuous_update(self, repeat_interval):
        while True:
            if self.stopped or has_been_closed():
                break
            self.get_new_values()
            if self.stopped or has_been_closed():
                break
            time.sleep(repeat_interval)

        self.save_data()
        self.fully_stopped = True

    def begin_update_thread(self, repeat_interval):
        self.thread = threading.Thread(target=self.continuous_update, args=(repeat_interval,))
        self.thread.start()

    def save_data(self):
        # if file does not exist write to file with header
        if not os.path.isfile(self.output_path):
            self.data_df.to_csv(self.output_path, header=True)
        else:  # else it exists so append without writing the header
            self.data_df.to_csv(self.output_path, mode='a', header=False)

    def stop(self):
        self.stopped = True

    def is_fully_stopped(self):
        return self.fully_stopped
import sys
import numpy as np
import datetime as dt
import matplotlib
import matplotlib.pyplot as plt

# use ggplot style for more sophisticated visuals
plt.style.use('ggplot')

is_closed = False
panning_allowed = False


def enable_panning(event):
    global panning_allowed
    panning_allowed = True


def disable_panning(event):
    global panning_allowed
    panning_allowed = False


def has_been_closed():
    return is_closed


def window_closed(event):
    global is_closed
    is_closed = True


# Converts a numpy.datetime64 to a datetime.datetime object by converting dt64 to UTC time (for later use)
def datetime64_to_datetime(dt64):
    return dt.datetime.utcfromtimestamp((dt64 - np.datetime64('1970-01-01T00:00:00Z')) / np.timedelta64(1, 's'))


# Gets a list of x (time) and y (sensor reading) coordinates for the index-th column of data_df
# Also returns the labels for the x ticks (strings in HH:MM:SS) format
def get_coordinate_lists(data_df, index):
    time_list = data_df['Time'].tolist()
    value_list = data_df.iloc[:, index].tolist()

    time_list = [datetime64_to_datetime(time) for time in time_list]

    # Convert time_list to timedeltas, representing the time between each element of time_list and time_list[0]
    time_list = list(map(lambda time: time - time_list[0], time_list))

    # Convert the timedeltas to seconds
    time_list_seconds = list(map(lambda timedelta: round(timedelta.total_seconds()), time_list))

    # Convert the timedeltas to HH:MM:SS format
    time_list_strings = list(map(lambda timedelta: "%.2d:%.2d:%.2d" % (
        int(timedelta.seconds / 3600), (timedelta.seconds // 60) % 60, timedelta.seconds % 60), time_list))

    return time_list_seconds, value_list, time_list_strings


def live_plotter_init(data_df, lines, formats, labels, xlabel='X Label', ylabel='Y Label', title='Title'):
    plt.ion()
    fig = plt.figure(figsize=(13, 9))
    ax = fig.add_subplot(111)

    # Set window title
    gcf = plt.gcf()
    gcf.canvas.set_window_title(title)

    # Event bindings
    close_bind = fig.canvas.mpl_connect('close_event', window_closed)
    enter_bind = fig.canvas.mpl_connect('axes_enter_event', enable_panning)
    exit_bind = fig.canvas.mpl_connect('axes_leave_event', disable_panning)

    # Setup mouse wheel zooming
    def zoom_factory(ax, base_scale=2.):
        def zoom_fun(event):
            # get the current x and y limits
            cur_xlim = ax.get_xlim()
            cur_ylim = ax.get_ylim()
            cur_xrange = (cur_xlim[1] - cur_xlim[0]) * .5
            cur_yrange = (cur_ylim[1] - cur_ylim[0]) * .5
            xdata = event.xdata  # get event x location
            ydata = event.ydata  # get event y location
            if event.button == 'up':
                # deal with zoom in
                scale_factor = 1 / base_scale
            elif event.button == 'down':
                # deal with zoom out
                scale_factor = base_scale
            else:
                # deal with something that should never happen
                scale_factor = 1
                print
                event.button
            # set new limits
            ax.set_xlim([xdata - cur_xrange * scale_factor,
                         xdata + cur_xrange * scale_factor])
            ax.set_ylim([ydata - cur_yrange * scale_factor,
                         ydata + cur_yrange * scale_factor])
            plt.draw()  # force re-draw

        fi = ax.get_figure()  # get the figure of interest
        # attach the call back
        fi.canvas.mpl_connect('scroll_event', zoom_fun)

        # return the function
        return zoom_fun

    zoom = zoom_factory(ax)

    # Plot initial data
    for index in range(len(lines)):
        x_vec, y_vec, skip = get_coordinate_lists(data_df, index)
        lines[index] = ax.plot(x_vec, y_vec, formats[index], alpha=0.8, label=labels[index])

    ax.legend(loc='upper right')
    plt.xlabel(xlabel)
    plt.ylabel(ylabel)
    plt.title(title)
    plt.gcf().subplots_adjust(bottom=0.15)
    plt.show()


# Update the line graph
def live_plotter_update(data_df, lines, pause_time=0.01, max_points_to_show=10):
    # All x_vec and y_vec lists, used to set the bounds of the graph
    x_vecs = []
    y_vecs = []
    last_x_vec = None  # Store the last x_vec, in full (not only the last max_points_to_show points), for time labeling
    time_list_strings = None

    for index in range(len(lines)):
        x_vec, y_vec, list_strings = get_coordinate_lists(data_df, index)

        lines[index][0].set_data(x_vec, y_vec)

        # Add to x_vecs and y_vecs
        x_vecs.append(x_vec[-max_points_to_show:])
        y_vecs.append(y_vec[-max_points_to_show:])

        # Override time_list_strings
        time_list_strings = list_strings

        # Override last_x_vec, so the time labels are properly applied to all points, not just those visible
        last_x_vec = x_vec

        if has_been_closed():
            return  # Exit program early if closed

    # Do not adjust bounds if panning because it will send them back to the original view
    if not panning_allowed:
        # Adjust the bounds to fit all the lines on the screen and only show at most max_points_to_show at once

        # Find the smallest and largest x values (in the last max_points_to_show of each x_vec in x_vecs)
        smallest_x = np.min(x_vecs)
        largest_x = np.max(x_vecs)

        # Find the smallest and largest y values (in the last max_points_to_show of each y_vec in y_vecs)
        smallest_y = np.min(y_vecs)
        largest_y = np.max(y_vecs)

        # Update the x axis to use time_list_strings instead of values in seconds for easier reading (HH:MM:SS format)
        plt.xticks(last_x_vec, time_list_strings, rotation=-45, ha="left", rotation_mode="anchor")

        # Adjust the bounds to be a fraction of the standard deviation past the max and min points, to keep space
        # between the points and the borders
        plt.xlim(smallest_x - np.std(np.asarray(x_vecs).astype(np.float32)) / 3,
                 largest_x + np.std(np.asarray(x_vecs).astype(np.float32)) / 3)
        plt.ylim(smallest_y - np.std(np.asarray(y_vecs).astype(np.float32)) / 2,
                 largest_y + np.std(np.asarray(y_vecs).astype(np.float32)) / 2)

    if has_been_closed():
        return  # Exit program early if closed

    plt.pause(pause_time)