Introducing the EA Dashboard!

What is the EA Dashboard?
Throughout this year, I have been working on a project for Energize Andover. I call it the “Energize Andover Dashboard,” or “EA Dashboard” for short. It is a web application that allows its users to customize a dashboard that displays various types of town data.
On the front end, the dashboard is composed of two essential components: the layout and the widgets. Widgets are unique graphs (or other forms of displaying data) for a specific subset of town data, such as a line graph of the total electricity used by Andover High School at the end of every day in the past week. Although I intend on creating many types of widgets, the majority will be similar to the previous example: interactive charts that update with new data. The layout, on the other hand is the arrangement and sizes of these widgets on the dashboard. Widgets have different aspect ratios (some are square, some are rectangular, etc.) and thus the layout will determine what widgets are displayed, and where on the dashboard those widgets lie.
Application Structure
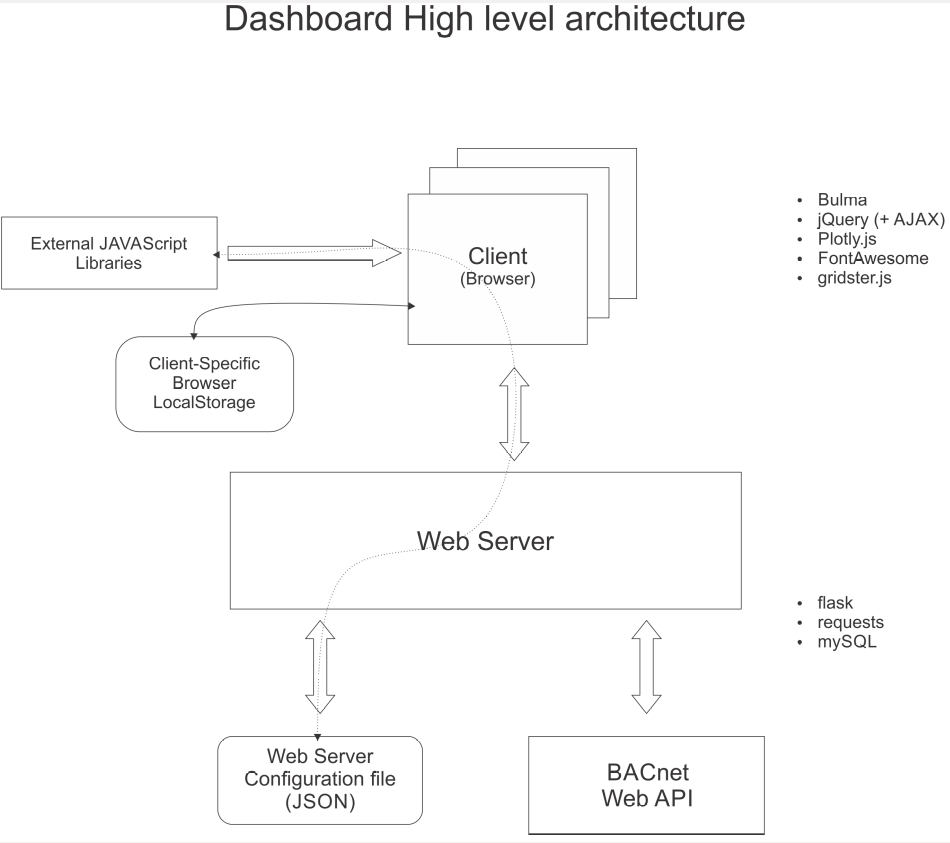
I have done my best to design the application so that the server sustains the lightest loads possible, generating the graphs, layout, and more in the client’s browser and minimizing interactions between the clients and the server as much as possible.
On the server side, a Flask application hosts a web server. This server retrieves data from our BACnet API using the requests package, but this data-retrieval process will eventually be replaced by one that uses MySQL to query the server that Ayush is currently building.
This server takes the data it gathers and makes it accessible by the clients and also generates a configuration JSON file that details the requirements of each widget that may appear on the dashboard (such as the “aspect ratio” of the grid element’s size, what subset of the data it will be using, the chart type and option overrides, etc.). Thus, each client’s browser handles much of the computation and rendering of the data. Bulma, a CSS framework, is used to style the site and create much of the layout. FontAwesome icons are used throughout the site to make the UI more intuitive, and jQuery is used for most of the JavaScript functionality and interactivity. Gridster.js, along with lots of my own code that I wrote to correct its flaws (the library is no longer being developed), is used to create an intuitive layout configuration system that involves draggable, stretchable rectangles on a 4x4 grid. This layout is stored in the client’s browser-specific LocalStorage, to avoid the need for a separate database for this project, along with which widgets are to be populated in which of the grid’s boxes. This information is later pulled from the LocalStorage and is used to generate the containers and layout for the dashboard’s widgets on the main page. The JavaScript libraries are then used to pull the data, pull the requirements for each widget, and gather all the information needed to generate a widget. Finally, Plotly.js is used to generate clean, interactive charts for the widgets in each grid element. Overall, this structure was designed to reduce the load on the server and to be fully functional without a server-side database to store configuration information or the expiration of cookie-based data storage.
The Present
So far, I have done much of the front-end work for the dashboard. I have built a full layout customization system by implementing gridster.js and writing a good amount of custom JavaScript to fix its flaws and mold it to my purposes. I have set up the integration with LocalStorage, designed a clean and intuitive interface, and have had the layout apply to the dashboard page. I have also configured and set up Plotly.js with some test widgets and experimented with various layouts to test the connection between layouts and widgets. I have also set up most of the data collection process for the server, but I have not made a connection between the server’s data and the front-end Plotly.js.
The Future
I will do my best to finish this project by the end of the summer. The next step for me is to complete the data-collecting code on the server side and run thorough testing. When that is complete, I will work on connecting the data from the backend to Plotly.js.